Thursday, July 31, 2014

China PMI Adds to View Economy is Steadying

China’s factories posted their strongest growth in at least 1-1/2 years in July as new orders surged to multi-month highs, two surveys showed on Friday, cementing bets that the economy is re-gaining momentum after a spate of stimulus measures.

The official Purchasing Managers’ Index (PMI) issued by the government climbed to a 27-month high of 51.7 in July, beating forecasts for 51.4.  A separate PMI published by HSBC/Markit also rose to 51.7, its best performance in 18 months.

A reading above 50 indicates an expansion in activity on a monthly basis, and below that a contraction.  Analysts welcomed the data as a sign that the world’s second-biggest economy is enjoying a revival after a rocky spell prompted authorities to launch a volley of support measures, including increasing bank lending to spur growth.

Reuters

Australian Equities Lead Asia Lower

Stocks in Asia fell on Friday, with Australia leading the losses, as the region lost ground after a substantial overnight selloff in the U.S.  The S&P/ASX 200 lost 1.3% after stocks on Wall Street experienced their biggest one-day decline since February in the previous session, with the Dow Jones Industrial Average plunging 1.9% on Thursday.

Elsewhere in Asia, Japan’s Nikkei lost 0.3% and South Korea’s Kospi was 0.1% lower, and Singapore’s Straits Times Index lost 0.8%. Hong Kong’s Hang Seng Index was down 0.5%.

The causes behind the fall were diverse, as a number of issues that have knocked markets in recent weeks flared up at the same time—such as Argentina’s recent bond default, and Portugal’s second-largest bank by assets posting a record quarterly loss after it found more bad-loan exposure to its parent than expected. Furthermore, geopolitical concerns remained prominent—particularly in Ukraine and Gaza.

WSJ

GBP/USD Drops to Seven Week Low at 1.6870

The pound posted its biggest monthly decline against the dollar since May 2013 as signs of growth in the U.S. economy boosted expectations for higher Federal Reserve interest rates.

Sterling fell to a seven-week low versus the greenback as data showed U.K. consumer confidence dropped in July and house prices grew at the slowest pace since April 2013. Bank of England Deputy Governor Ben Broadbent said in an interview with Bloomberg News yesterday that the “edge is coming off” the housing market. The pound weakened for a fourth day against the euro, while U.K. government bonds fell as data added to evidence the U.S. labor market is strengthening.

“Both the U.K. housing and consumer confidence data releases were on the weaker side and I would expect further declines for pound-dollar,” said Neil Jones, head of hedge-fund sales at Mizuho Bank Ltd. in London. “The Broadbent comments catalyze the selling process. Investors who were looking to sell on a small blip will go to the market and sell on these comments. For me, it was a warning that rates should not be raised too quickly.”

Bloomberg

USD/CAD at Seven Week High at 1.0920

Canada’s dollar touched the weakest level in almost two months as data showing the economy expanded in May failed to damp concern growth is lagging behind that of the U.S., its largest trading partner.

The currency later erased losses amid bets it had dropped too far, too fast. It fell for the first month since January even as the government said Canadian gross domestic product rose 2.3 percent from a year earlier, matching a Bloomberg forecast. The American economy climbed 4 percent at an annual rate in the second quarter, data showed yesterday. Initial U.S. jobless claims fell to an eight-year low in the past month, a report showed today, before July employment data due tomorrow.

“Initial jobless claims in the U.S. is signaling a relatively good reading for tomorrow’s nonfarm payrolls,” Martin Schwerdtfeger, a currency strategist at Toronto-Dominion Bank’s TD Securities unit in Toronto, said in a phone interview. “The Canadian GDP print came on consensus.”

Bloomberg

Euro is Bitten as Interest in EZ Assets Declines

The international appetite for euro-zone financial assets that underpinned the local currency the past two years is beginning to erode.

While broad data showing real-time flows into and out of the region’s stocks and bonds are hard to find, strategists point to items such as U.S. exchange-traded funds, which pulled $1.1 billion from European assets this month, the first outflow since April 2013. Bonds of Italy and Spain that yielded as much as 7.05 percentage points more than Treasuries two years ago now pay less than their U.S. counterparts, diminishing their appeal.

The result is the euro’s biggest monthly loss since February 2013, and Morgan Stanley said this week selling the 18-nation currency remains the surest bet in the developed world. Rather than a cause for concern, the European Central Bank may see weakness in the euro as a welcome development as it tries to avoid deflation and spur exports to boost the economy.

Bloomberg

EUR/USD down at 1.3385 on U.S. Economic Outlook

The dollar headed for a third weekly gain versus the euro, the longest stretch in two months, as signs of a sustained U.S. recovery boost speculation the Federal Reserve is moving toward raising interest rates.

The Bloomberg Dollar Spot Index approached the strongest since March as economists said data today will show U.S. employers boosted jobs and the Fed’s preferred gauge of inflation was near the most since 2012. The dollar rose for an 11th day versus the yen, the longest stretch since 2001. Australia’s dollar headed for a weekly loss as a private report showed Chinese manufacturing grew less than earlier estimated. Most Asian currencies fell including the Philippine peso and South Korean won.

“We’ve had data confirming that the U.S. economy is a bit stronger than what everyone previously thought, and the Fed is slowly, slowly moving toward normalizing policy,” said Janu Chan, an economist at St. George Bank Ltd. in Sydney. “The trend is for the dollar to move higher.”

Bloomberg

Gold at $1283 on Reduced Safe Haven Demand

Gold held near a six-week low on Friday and was on track for a third straight weekly loss as U.S. economic optimism offset any safe-haven demand from geopolitical tensions.

The optimism stemming from a string of strong U.S. data is likely to increase as the July nonfarm payrolls report scheduled for release later in the day is expected to show the world’s top economy maintaining a solid pace of jobs growth.

Spot gold edged up slightly to $1,283.80 an ounce by 0309 GMT, after falling 1 percent in the previous session. It hit $1,280.76 on Thursday – its lowest since June 19.  Gold was on track for a 2 percent fall for the week, after posting its sharpest monthly drop of the year in July. The third consecutive weekly drop would be gold’s longest such losing streak since September.

CNBC

Brent Oil Steady at $106 on Ample Supply

Brent crude held near $106 a barrel on Friday as ample supply continued to drag on prices a day after the benchmark posted its worst monthly performance since April 2013.

Analysts expect global production to exceed demand this year, while a supply glut has built up in Africa and Europe.  Brent crude was flat at $106.02 a barrel by 0322 GMT after a 5.6 percent drop in prices last month.

U.S. crude futures for September delivery fell 13 cents to $98.04 a barrel, following a 6.8 percent decline last month, the biggest monthly loss since May 2012.  “Suddenly, people wake up and realize that even with the geopolitical risks in the world there is this surplus of physical crude,” said Tony Nunan, a senior risk manager at Mitsubishi Corp.

CNBC

U.S. Dollar Steady Before Jobs Data

Dollar bulls took a breather on Friday ahead of a closely watched jobs report that has the potential to make or break a rally that saw the greenback post its best monthly performance in over a year.

The dollar index was steady at 81.479, having risen 2.1 percent in July to a 10-1/2 month peak of 81.573.  Against the yen, the dollar edged up 0.1 percent to 102.89 yen but stayed below a four-month high of 103.15 yen struck on Wednesday.

The question now is whether this is the beginning of a lasting uptrend, one that has frustrated dollar bulls for much of this year, or another false start.  The U.S. jobs report due at 1230 GMT could provide a clue. A Reuters survey of economists showed payrolls probably increased by 233,000 in July.

CNBC

Asian Equities Lower After China PMI

Asian stocks were mostly lower on Friday following a global market selloff overnight but upbeat data from the world’s second-largest economy helped cap larger losses.

China’s official purchasing manager’s index (PMI) rose to a better-than-expected 51.7 in July, better than the country’s 51 reading in June. Meanwhile, HSBC’s final July reading also came in at 51.7, which was an 18-month high.

Attention was also on the U.S. July jobs report, due later on Friday. Economists expect to see the nonfarm payrolls rise by 233,000 and unemployment rate at 6 percent, which would be down from the 288,000 jobs added in June when the jobless rate stood at 6.1 percent.

CNBC

Gold – Drops to Six Week Low Near $1280

Gold for Friday, August 1, 2014

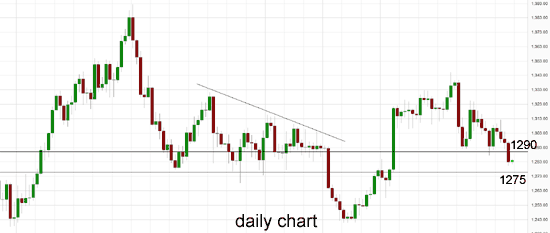
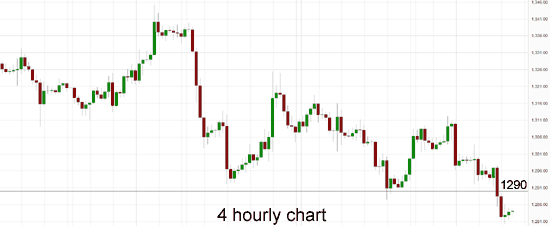
In the last few days gold has been easing lower and placing pressure on the support level at $1300 which eventually gave way resulting in gold falling sharply back down to a six week low near $1280.   Over the last few weeks the $1290 level has shown some signs of support and held gold up, however now that it has been broken, it may provide some resistance in the near future.   Gold did well at the end of last week to surge higher through the $1300 level back up towards $1310 before easing slightly to start this new week. The $1300 level has been reinforced as a level of significance in the last couple of weeks with gold falling sharply from its highs above $1345 back down to this level where it was initially met with overwhelming demand.  During the second half of June, gold steadily moved higher but showed numerous incidents of indecision with its multiple doji candlestick patterns on the daily chart. This happened around $1320 and $1330.

Several weeks ago now gold enjoyed a stunning surge higher to break through some key levels along its way to reaching a then two month high just above $1320 and immediately after it eased away ever so slightly and consolidated with its flow of doji patterns. It was then able to slowly move higher to a four month high above $1345. It was also able to break through the $1300 level which has recently played a role again. If sellers do take advantage of these relatively higher prices which will most likely bring the $1300 level back into play. The OANDA long position ratio has surged back up above 70% showing a change in sentiment to more bullish.  At the beginning of June, gold did very well to repair some damage and return to the key $1275 level, then it has continued the momentum pushing a higher to its recent four month high.

After moving so little for an extended period, gold dropped sharply back in May from above the well established support level at $1275 as it completely shattered this level falling to a four month low around $1240. It remained around support at $1240 for several days before its strong rally higher.  It pushed down towards $1280 before sling shotting back and also had an excursion above $1300 for a short period before moving quickly back to the $1293 area again. Over the last few weeks gold has eased back from around $1315 to establish its recent narrow trading range below $1295 before its recent slump.

Over the last few months the $1275 level has established itself as a level of support and on several occasions has propped up the price of gold after reasonable falls. Throughout the second half of March gold fell heavily from resistance around $1400 back down to a several week low near support at $1275. Both these levels remain relevant as $1275 continues to offer support and the $1400 level is likely to play a role again should gold move up higher. Through the first couple of months of this year, gold moved very well from a longer term support level around $1200 up towards a six month higher near $1400 before returning to its present trading levels closer to $1300.

Gold was stuck near a six-week low on Friday and headed for a third straight weekly loss, as U.S. economic optimism offset any safe-haven demand from geopolitical tensions and lower equities.  Spot gold was little changed at $1,282.79 an ounce by 0017 GMT, after falling 1 percent in the previous session. It hit $1,280.76 on Thursday – its lowest since June 19.  Gold was on track for a 2 percent fall for the week, after posting its sharpest monthly drop of the year in July.  The metal was hurt by data on Thursday that showed that U.S. labor costs recorded their biggest gain in more than 5-1/2 years in the second quarter, bolstering the economy’s outlook. A strong economy blunts gold’s appeal as an alternative to riskier assets such as equities.  Investors were now awaiting U.S. non-farm payrolls data to for further clues about the economy, even as they were keeping an eye on geopolitical tensions in the Middle East and Ukraine.

(Daily chart / 4 hourly chart below)

g_20140801 g_20140801_4hour

Gold August 1 at 04:15 GMT   1284.1   H: 1285.1   L: 1281.4

Gold Technical

S3

S2

S1

R1

R2

R3

1275

1240

1330

During the early hours of the Asian trading session on Friday, Gold is trading in a very small range between $1282 and $1284 after dropping sharply over the last couple of days.  Current range: trading right around $1284.

Further levels in both directions:

• Below: 1275 and 1240.

• Above: 1330.

OANDA’s Open Position Ratios

g_20140801_ratio

(Shows the ratio of long vs. short positions held for Gold among all OANDA clients. The left percentage (blue) shows long positions; the right percentage (orange) shows short positions.)

The long position ratio for Gold has surged to above 70% as gold has fallen back under $1300 again. The trader sentiment is strongly in favour of long positions.

Economic Releases

01:30 AU PPI (Q2)

05:00 JP Vehicle Sales (Jul)

08:00 EU Manufacturing PMI (Jul)

08:30 UK CIPS/Markit Manufacturing PMI (Jul)

12:30 US Core PCE Price Index (Jun)

12:30 US Non-farm Payrolls (Jul)

12:30 US Personal income & spending (Jun)

12:30 US Private Payrolls (Jul)

12:30 US Unemployment (Jul)

13:45 US Manufacturing PMI (Jul)

13:55 US Univ of Mich Sent. (Final) (Jul)

14:00 US Construction Spending (Jun)

14:00 US ISM Manufacturing (Jul)

*All release times are GMT

This article is for general information purposes only. It is not investment advice or a solution to buy or sell securities. Opinions are the authors; not necessarily that of OANDA Corporation or any of its affiliates, subsidiaries, officers or directors. Leveraged trading is high risk and not suitable for all. You could lose all of your deposited funds.

Australia 200 – Falls Sharply from Six Year High

Australia 200 for Friday, August 1, 2014

After being on quite a roll for several weeks, the Australian 200 Index has fallen sharply over the last few days returning back to below the 5550 level in the process.  The solid move higher saw it move strongly up through both the 5500 and 5550 levels to reach a new six year high around 5620 earlier this week.  In recent weeks it has discovered a new key level to deal with after running into a short term resistance level at 5550, which in the last few days has provided some solid support. It reversed strongly a few weeks ago bringing it back down to almost touch the 5400 level before rallying back higher again. At the beginning of June the Australian 200 Index fell and broke back down through the key 5500 level towards a four week low around 5400 before consolidating and resting on support there for an extended period. These two levels have firmly established themselves as significant and any substantial break to either side will most likely be a significant move and be closely monitored. It is quite likely many are sitting on the sidelines waiting for the break before committing as they continue to watch the index move between these two levels.

Back at the end of May, it moved back and forth between the two key levels of 5500 and 5550 before the recent fall. Over the last couple of months the Australia 200 Index has formed an amazing attraction to the key 5500 level as it spent a considerable amount of time trading around it. A couple of weeks ago, the index fell away heavily back down to support around 5400 before returning to the key 5500 level just as quickly, as if gravity had pulled it back. Throughout the last couple of months it has been placing ongoing pressure on the resistance level at 5500 and a few weeks ago it was finally able to move through to a three week high before easing back again to this key level. Several weeks ago it slowly but surely eased away from its multi-year high achieved near 5560 however the following week it fell reasonably sharply and started looking towards the 5400 level which is near where it currently sits. In doing so it returned to back under the key 5500 level which has provided some reasonable resistance over the last few months.

For the bulk of the last few months, the Australia 200 Index has traded roughly between 5300 and 5500 therefore its return to back under 5500 was not surprising. The index has done well over the last couple of months to move steadily higher from support around 5300 up to beyond 5500, forming higher peaks and higher troughs along the way. The support level at 5300 may also be called upon should the index fall lower and will also likely play a role in providing some buffer from any decline. Since February, most of the trading activity has occurred between 5400 and 5500 therefore the former level may also be called upon to prop up prices. The index has done very well over the last couple of years moving from below 4000 to its present trading levels around 5500.

Slow credit growth, falling export prices and a drop in home-building approvals – it was hardly an encouraging set of economic data for Australia on Thursday.  But it was a pretty good illustration of the problems facing the economy.  A 7.9 per cent fall in the export price index in the June quarter, reported by the Australian Bureau of Statistics on Thursday, was dominated by weaker minerals markets.  It extended the fall to since the peak in 2011 to 15 per cent.  The fall has been partially cushioned by a lower exchange rate.  In foreign currency terms, export commodity prices have dropped over 30 per cent in just three years, according to the commodity price index compiled by the RBA.  But the hit to export revenue will still drag on the economy, accentuating the impact of the slowdown in resource sector investment.  The building industry is one of the great hopes for the economy’s transition away from mining, the so-called rebalancing.

(Daily chart below)

asx_20140801

Australia 200 August 1 at 03:55 GMT   5524   H: 5560   L: 5521

Australia 200 Technical

S3

S2

S1

R1

R2

R3

5400

5300

5000

During the hours of the Asian trading session on Friday, the Australia 200 Index is falling sharply back below the 5550 level after moving strongly for the last few weeks. It is presently trading above the key levels of 5500 and will be looking to see if it can maintain the break and stay above. For most of this year the Australia 200 Index has moved well from the lower support level at 5000 up to the multi-year highs above 5500 in the last month or so.

Further levels in both directions:

• Below: 5400, 5300 and 5000.

• Above: —

Economic Releases

01:30 AU PPI (Q2)

05:00 JP Vehicle Sales (Jul)

08:00 EU Manufacturing PMI (Jul)

08:30 UK CIPS/Markit Manufacturing PMI (Jul)

12:30 US Core PCE Price Index (Jun)

12:30 US Non-farm Payrolls (Jul)

12:30 US Personal income & spending (Jun)

12:30 US Private Payrolls (Jul)

12:30 US Unemployment (Jul)

13:45 US Manufacturing PMI (Jul)

13:55 US Univ of Mich Sent. (Final) (Jul)

14:00 US Construction Spending (Jun)

14:00 US ISM Manufacturing (Jul)

*All release times are GMT

This article is for general information purposes only. It is not investment advice or a solution to buy or sell securities. Opinions are the authors; not necessarily that of OANDA Corporation or any of its affiliates, subsidiaries, officers or directors. Leveraged trading is high risk and not suitable for all. You could lose all of your deposited funds.

AUD/USD – Desperately Clinging to 0.9300

AUD/USD for Friday, August 1, 2014

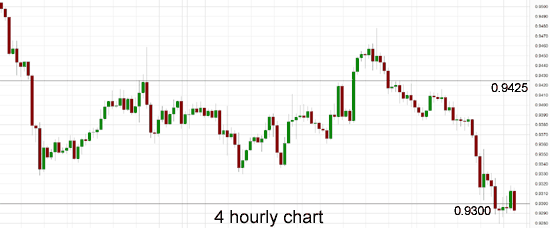
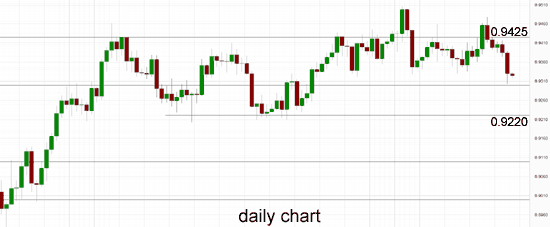
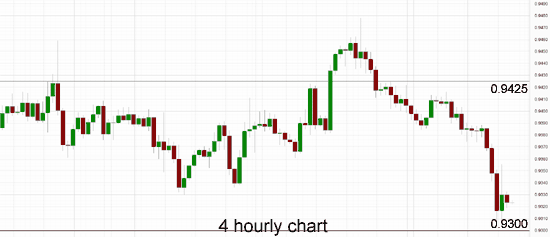
The Australian dollar is presently trying to cling onto the 0.93 level after its sharp over the last few days which saw it move from above  0.9400 down to a seven week low just below 0.9300.  It has spent the last few days easing back below both the 0.9425 and 0.9400 levels with the former providing some resistance. The Australian dollar reached a three week high just shy of 0.9480 towards the end of last week after it enjoyed a solid period which saw it surge higher through the resistance level at 0.9425 to the three week around 0.9480, before easing back towards that level. It started last week by slowly easing away from the resistance level around 0.9425 which continues to stand tall and play havoc with buyers. The Australian dollar enjoyed a solid surge higher reaching a new eight month high above 0.95 a few weeks ago, only to return most of its gains in very quick time to finish out that week. Since the middle of June the Australian dollar has made repeated attempts to break through the resistance level around 0.9425, however despite its best efforts it was rejected every time as the key level continued to stand tall, even though it has allowed the small excursion to above 0.95.

After the Australian dollar had enjoyed a solid surge in the first couple of weeks of June which returned it to the resistance level around 0.9425, it then fell sharply away from this level back to a one week low around 0.9330 before rallying higher yet again. Its recent surge higher to the resistance level around 0.9425 was after spending a couple of weeks at the end of May trading near and finding support at 0.9220. The 0.9220 level has repeatedly reinforced its significance as it is again likely to support price should the Australia dollar retreat further. Throughout April and into May the Australian dollar drifted lower from resistance just below 0.95 after reaching a six month high in that area and down to the recent key level at 0.93 before falling lower. During this similar period the 0.93 level has become very significant as it has provided stiff resistance for some time.

The Australian dollar appeared to be well settled around 0.93 which has illustrated the strong resurgence it has experienced throughout this year. For the best part of February and March the Australian dollar did very little other than continue to trade around the 0.90 level, although at the beginning of March it crept a little lower down to a three week low below 0.89. Towards the end of March however, the Australian dollar surged higher strongly moving to the resistance level at 0.93 before consolidating for a week or so.

Slow credit growth, falling export prices and a drop in home-building approvals – it was hardly an encouraging set of economic data for Australia on Thursday.  But it was a pretty good illustration of the problems facing the economy.  A 7.9 per cent fall in the export price index in the June quarter, reported by the Australian Bureau of Statistics on Thursday, was dominated by weaker minerals markets.  It extended the fall to since the peak in 2011 to 15 per cent.  The fall has been partially cushioned by a lower exchange rate.  In foreign currency terms, export commodity prices have dropped over 30 per cent in just three years, according to the commodity price index compiled by the RBA.  But the hit to export revenue will still drag on the economy, accentuating the impact of the slowdown in resource sector investment.  The building industry is one of the great hopes for the economy’s transition away from mining, the so-called rebalancing.

(Daily chart / 4 hourly chart below)

a_20140801 a_20140801_4hour

AUD/USD August 1 at 02:50 GMT   0.9287   H: 0.9318   L: 0.9285

AUD/USD Technical

S3

S2

S1

R1

R2

R3

0.9300

0.9220

0.9100

0.9425

0.9500

During the early hours of the Asian trading session on Friday, the AUD/USD is dropping sharply back through the 0.93 level after recently rally back up higher through it.  The Australian dollar was in a free-fall for a lot of last year falling close to 20 cents and it has done very well to recover slightly to well above 0.95 again. Current range: trading below 0.9300 around 0.9290.

Further levels in both directions:

• Below: 0.9300, 0.9220 and 0.9100.

• Above: 0.9425 and 0.9500.

OANDA’s Open Position Ratios

a_20140801_ratio

(Shows the ratio of long vs. short positions held for the AUD/USD among all OANDA clients. The left percentage (blue) shows long positions; the right percentage (orange) shows short positions.)

The long position ratio for the AUD/USD has moved back up strongly from its lowest level in over one year as the Australian dollar has eased right back towards 0.93. The trader sentiment has changed to being in favour of long positions.

Economic Releases

01:30 AU PPI (Q2)

05:00 JP Vehicle Sales (Jul)

08:00 EU Manufacturing PMI (Jul)

08:30 UK CIPS/Markit Manufacturing PMI (Jul)

12:30 US Core PCE Price Index (Jun)

12:30 US Non-farm Payrolls (Jul)

12:30 US Personal income & spending (Jun)

12:30 US Private Payrolls (Jul)

12:30 US Unemployment (Jul)

13:45 US Manufacturing PMI (Jul)

13:55 US Univ of Mich Sent. (Final) (Jul)

14:00 US Construction Spending (Jun)

14:00 US ISM Manufacturing (Jul)

*All release times are GMT

This article is for general information purposes only. It is not investment advice or a solution to buy or sell securities. Opinions are the authors; not necessarily that of OANDA Corporation or any of its affiliates, subsidiaries, officers or directors. Leveraged trading is high risk and not suitable for all. You could lose all of your deposited funds.

China Official PMI Rises to 51.7

Activity in China’s vast manufacturing sector continued to pick up steam in July, official data showed on Friday.  The official Purchasing Managers’ Index (PMI) came in at 51.7 in July, better than a Reuters forecast for 51.4 and after the 51.0 reading in June.

Markets are also waiting for the HSBC final PMI reading for July due shortly, after the flash reading rose to an 18-month high of 52.0.  The 50-point level separates growth in activity from contraction.

Asian stocks trimmed their losses while the Australian dollar reversed losses, inching up 0.1 percent against the greenback.

CNBC

Five Reasons Affecting the Markets

Stocks are sharply lower, with European stocks trading ugly right from the start. Germany is down more than one percent, and is lodged at the lowest levels in nearly three months.

Several factors are moving our markets, including:

1) The rhetoric in Ukraine is getting downright vitriolic.
2) Adidas cites Russian exposure risk.
3) Portuga’s Banco Espirito Santo posted a $4.8 billion loss.
4) We saw the 10-year yields spike to over 2.6 percent.
5) Argentina’s default.

via CNBC

Oil Drops After Refinery Fire and Strong USD

West Texas Intermediate crude fell to a four-month low amid global declines in stocks and commodities and after CVR Refining LP said a Kansas refinery won’t start operating soon.

The plant in Coffeyville may be shut for four weeks after a fire this week, CVR Chief Executive Officer Jack Lipinski said today on an earnings call. The plant uses crude from Cushing, Oklahoma, the delivery point for WTI futures. The Bloomberg Commodity Index (BCOM) dropped to a five-month low and the Standard & Poor’s 500 Index headed for the first monthly drop since January.

“Coffeyville is bringing the market down,” said Phil Flynn, senior market analyst at the Price Futures Group in Chicago. “You are going to be using less crude from Cushing. There is also broad concern about global stock markets.”

WTI for September delivery slid $1.77, or 1.8 percent, to $98.50 a barrel at 12:50 p.m. on the New York Mercantile Exchange. The volume of all futures traded was about 20 percent above the 100-day average. Prices are down 6.5 percent in July, the most in nine months. The premium of September contracts over October slumped to 96 cents from $1.23 yesterday on the highest volume since July 23.

Brent for September settlement slipped 83 cents, or 0.8 percent, to $105.68 a barrel on the London-based ICE Futures Europe exchange. Volume was 12 percent above the 100-day average. The European benchmark crude was at a premium of $7.17 to WTI on ICE, from $6.24 yesterday.

via Bloomberg

Gold Falls As USD Regains Strength

Gold futures dropped to a six-week low after a government report showed improvement in the U.S. labor market, damping demand for a haven.

Fewer Americans filed applications for unemployment insurance benefits over the past month than at any time in more than eight years. Federal Reserve officials yesterday continued to pare monthly asset purchases, while repeating that they’re likely to keep interest rates low for a “considerable time” as they look for improvement in a “range” of labor indicators.

Gold prices are headed for a July decline after rallying 10 percent in the first half of the year, a gain that outpaced broad measures of commodities, equities and treasuries. While buying was fueled by tensions in Ukraine and the Middle East, signs of U.S. growth reduced the appeal of bullion as an alternative asset.

Today’s report “supports the view that the Fed will raise rates sooner than expected, and that’s the reason for the decline in gold prices here,” Blake Robben, a senior market strategist at Archer Financial Services in Chicago, said in a telephone interview. “Obviously, when they start raising rates, gold will not perform in that environment. It never has.”

Gold futures for December delivery lost 0.5 percent to $1,290 an ounce at 9:08 a.m. on the Comex in New York, after touching $1,285.90, the lowest since June 19.

Interest-rate increases may come “sooner and be more rapid than currently envisioned” if the labor market continues to improve more quickly than anticipated, Fed Chair Janet Yellen told lawmakers this month. The U.S. central bank tapered monthly bond buying by $10 billion yesterday, to $25 billion.

Bullion jumped 70 percent from December 2008 to June 2011 as the Fed bought debt and held borrowing costs at an all-time low. The metal tumbled 28 percent last year, the most in three decades, as signs of accelerating U.S. economic growth raised concern that the stimulus would end.

via Bloomberg

Eurozone Inflation Falls Again Into ECB Danger Zone

Eurozone inflation has fallen to its lowest level since the height of the financial crisis, sliding further into what the European Central Bank (ECB) has described as a “danger zone”.

Prices rose in the single currency area by 0.4% in July, from 0.5% in June.

The ECB considers that an inflation rate of below 1% poses a risk of deflation.

Separate figures show that unemployment in the region fell slightly to 11.5% in June compared to 11.6% in May.

The new inflation figures from the European Union’s statistical office, Eurostat, show that the rate remains persistently below the ECB’s target rate of 2%. Prices have risen at an annualised rate of less than 1% for the last ten months.

Central Bank governor, Mario Draghi, has previously warned that he would deem inflation below 1% to be in a “danger zone”, which could lead to prices tipping into a deflationary spiral.

via BBC

Argentina Defaults For Second Time in 13 Years

Argentina has defaulted on its debt – for the second time in 13 years – after last-minute talks in New York with a group of bond-holders ended in failure.

So-called “vulture fund” investors were demanding a full pay-out of $1.3bn (766m) on bonds they hold.

Argentina has said it cannot afford to do so, and has accused them of using its debt problems to make a big profit.

A US judge had set a deadline of 04:00 GMT on Thursday for a deal. The crisis stems from Argentina’s 2001 default.

Late on Wednesday evening, Argentina’s Economy Minister Axel Kicillof said the investors had rejected the government’s latest offer.

“Unfortunately, no agreement was reached and the Republic of Argentina will imminently be in default,” Daniel Pollack, the court-appointed mediator in the case, said in a statement on Wednesday evening.

via BBC

G7 Warn Russia on Further Sanctions

The United States and European leaders say they’re prepared to intensify sanctions against Russia unless it moves to de-escalate the crisis in Ukraine.

The Group of Seven world leaders say in a statement that Russia hasn’t changed course despite the downing of a Malaysia Airlines jet. They’re calling the downing a watershed and say it should have led Russia to stop the flow of weapons and militants from Russia into Ukraine.

The leaders say they have “grave concern” about Russia’s actions. They say if Russia chooses de-escalation, the sanctions will be removed, but will otherwise be stepped up.

The statement comes the day after the U.S. and the European Union announced new economic sanctions on Russia.
The Group of Seven was re-arranged earlier this year to exclude Russia.

via CNBC

US Unemployment Claims Rise But Trend Still Positive

The number of Americans filing new claims for unemployment benefits rose last week, but the underlying trend pointed to a continuing strengthening of labor market conditions.

Other data on Thursday suggested a long-awaited acceleration in wage growth was imminent, with labor costs recording their largest increase in more than 5-1/2 years in the second quarter.

Initial claims for state unemployment benefits increased 23,000 to a seasonally adjusted 302,000 for the week ended July 26, the Labor Department said. Claims for the prior week were the lowest since May 2000.

“Unemployment claims have come down a lot as of late and suggest that labor market conditions continue to improve,” said Yelena Shulyatyeva, an economist at BNP Paribas in New York.

The four-week average of claims, considered a better gauge of labor market trends as it irons out week-to-week volatility, fell 3,500 to 297,250, the lowest level since April 2006.

Summer automobile plant shutdowns for retooling cause volatility in claims around this time of the year as automakers sometimes keep assembly lines running. This throws off a model the government uses to adjust the data for seasonal variations.

via Reuters

GBP/USD – Stuggling Pound Falls Below 1.69

GBP/USD continues its losing ways on Thursday, as the pair below the 1.69 level in the North American session. The pound has surrendered about 100 points this week to the surging US dollar. In economic news, British Nationwide HPI posted a weak gain of 0.1%. In the US, Unemployment Claims softened, but met expectations.

The British pound continues to head south, and dropped below 1.69 on Thursday, its lowest level since mid-June. The currency didn’t get any help from Nationwide HPI, an important housing inflation indicator. The index posted a gain of just 0.1%, its weakest performance in over a year. The markets had forecast a healthy gain of 0.6%. On Friday, the UK releases Manufacturing PMI, and this key index could have a significant impact on the direction of GDP/USD.

In the US, Unemployment Claims rose last week, hitting 302 thousand. This was within expectations, as the estimate stood at 303 thousand. We’ll get another look at key employment data on Friday, as the US releases Nonfarm Payrolls and the unemployment rate. Earlier in the week, ADP Nonfarm Payrolls softened, and the markets are bracing for a weak reading from the Friday NFP release, which could push the dollar down against its major rivals.

In the US, Advance GDP soared in Q2, posting a gain of 4.0%. This easily beat the estimate of 3.1%. The boost in economic activity was boosted by strong consumer confidence and business activity in Q2. The dollar has responded positively, posting broad gains. Earlier in the week, CB Consumer Confidence pointed to an optimistic US consumer. The key indicator jumped to 90.9 points, crushing the estimate of 85.5 points. This was the indicator’s highest level since September 2007. Consumer confidence is closely tracked by analysts since a confident consumer is likely to increase consumption, which is critical for economic growth.

GBP/USD for Thursday, July 31, 2014

GBP/USD July 31 at 14:05 GMT

GBP/USD 1.6887 H: 1.6927 L: 1.6858

GBP/USD Technical

S3

S2

S1

R1

R2

R3

1.6556

1.6700

1.6825

1.6920

1.7000

1.7183

GBP/USD lost ground late in the Asian session, and this continued throughout European trading, with the pair slipping to a low of 1.6858. The pound has changed directions and edged higher in the North American session.

1.6825 has weakened in support as the pound trades at lower levels. The round number of 1.67 is stronger.

1.6920 remains an immediate resistance line. The key 1.70 level is next.

Current range: 1.6825 to 1.6920.

Further levels in both directions:

Below: 1.6825, 1.6700 and 1.6556

Above: 1.6920, 1.7000, 1.7183 and 1.7228

OANDA’s Open Positions Ratio

GBP/USD is pointing to gains in long positions in Thursday trade, reversing the direction seen yesterday. This is not consistent with the movement of the pair, as the pound continues to lose ground. The majority of open positions in the GBP/USD ratio are short, indicative of a trader bias towards the dollar continuing to move higher.

GBP/USD Fundamentals

5:59 British Nationwide HPI. Estimate 0.6%. Actual 0.1%.

11:30 US Challenger Job Cuts. Actual 24.4%.

12:30 US Unemployment Claims. Estimate 303K. Actual 302K.

12:30 US Employment Cost Index. Estimate 0.5%. Actual 0.7%.

13:45 US Chicago PMI. Estimate 63.2 points. Actual 52.6 points.

14:30 US Natural Gas Storage. Estimate 92B. Actual 88B.

* Key releases are highlighted in bold
*All release times are GMT

Get OANDA’s exclusive weekly Market Pulse FX

Email Address:

Preferred Format:

HTML Text

This article is for general information purposes only. It is not investment advice or a solution to buy or sell securities. Opinions are the authors; not necessarily that of OANDA Corporation or any of its affiliates, subsidiaries, officers or directors. Leveraged trading is high risk and not suitable for all. You could lose all of your deposited funds.

USD/CAD – Loonie Improves on Canadian GDP

USD/CAD has dipped below the 1.09 level in Thursday’s North American session, as the Canadian dollar has halted its recent slide. The loonie received some much-needed help as Canadian GDP beat the estimate and posted a 0.4% gain in June. South of the border, US Unemployment Claims softened, coming in at 302 thousand.

The Canadian dollar has had a rough week, as USD/CAD climbed above the 1.09 for the first time since mid-June. The loonie has showed some life on Thursday, courtesy of unexpected positive news from Canadian GDP. The key indicator rose 0.4% in June, edging above the estimate of 0.3%. Canadian GDP is released on a monthly, rather than quarterly basis, and this was the indicator’s best showing since February.

In the US, Unemployment Claims rose last week, hitting 302 thousand. This was within expectations, as the estimate stood at 303 thousand. We’ll get another look at key employment data on Friday, as the US releases Nonfarm Payrolls and the unemployment rate. Earlier in the week, ADP Nonfarm Payrolls softened, and the markets are bracing for a weak reading from the Friday NFP release, which could push the dollar down against its major rivals.

In the US, Advance GDP soared in Q2, posting a gain of 4.0%. This easily beat the estimate of 3.1%. The boost in economic activity was boosted by strong consumer confidence and business activity in Q2. The dollar has responded positively, posting broad gains. Earlier in the week, CB Consumer Confidence pointed to an optimistic US consumer. The key indicator jumped to 90.9 points, crushing the estimate of 85.5 points. This was the indicator’s highest level since September 2007. Consumer confidence is closely tracked by analysts since a confident consumer is likely to increase consumption, which is critical for economic growth.

USD/CAD for Thursday, July 31, 2014

USD/CAD July 31 at 15:35 GMT

USD/CAD 1.0880 H: 1.0930 L: 1.0877

USD/CAD Technical

S3

S2

S1

R1

R2

R3

1.0678

1.0775

1.0852

1.0961

1.1004

1.1124

USD/CAD was uneventful in the Asian and European sessions. The pair has dropped below the 1.09 line in North American trading.

On the upside, 1.0961 has strengthened as the pair trades at lower levels.

1.0852 is an immediate support level. 1.0775 is stronger.

Current range: 1.0852 to 1.0961

Further levels in both directions:

Below: 1.0852, 1.0775, 1.0678 and 1.0572

Above: 1.0961, 1.1004 and 1.1124

OANDA’s Open Positions Ratio

USD/CAD ratio is pointing to gains in short positions in Thursday trade, reversing the movement we saw a day earlier. This is consistent with the pair’s movement, as the Canadian dollar has posted gains. The ratio is almost evenly split between long and short positions, indicative of a lack of trader bias regarding what direction the pair will take.

USD/CAD Fundamentals

12:30 Canadian GDP. Estimate 0.3%. Actual 0.5%.

11:30 US Challenger Job Cuts. Actual 24.4%.

12:30 US Unemployment Claims. Estimate 303K. Actual 302K.

12:30 US Employment Cost Index. Estimate 0.5%. Actual 0.7%.

13:45 US Chicago PMI. Estimate 63.2 points. Actual 52.6 points.

14:30 US Natural Gas Storage. Estimate 92B.

*Key releases are highlighted in bold

*All release times are GMT

Get OANDA’s exclusive weekly Market Pulse FX

Email Address:

Preferred Format:

HTML Text

This article is for general information purposes only. It is not investment advice or a solution to buy or sell securities. Opinions are the authors; not necessarily that of OANDA Corporation or any of its affiliates, subsidiaries, officers or directors. Leveraged trading is high risk and not suitable for all. You could lose all of your deposited funds.

AUD/USD – Struggling Aussie Dips Below 93

AUD/USD continues to lose ground on Thursday, as the pair trades below the 0.93 level early in the North American session. The pair has surrendered over 100 points this week and is trading at its lowest level since early April. On the release front, Australian Building Approvals was down sharply and US Unemployment Claims met expectations.

Australian Building Approvals tends to show strong fluctuations, making accurate forecasts a tricky task. After a strong gain in May, the key indicator reversed directions in June, posting a decline of 5.5%. This was much lower than the estimate of a 1.0% decline. It was also the indicator’s fourth drop in five months, pointing to trouble in the construction sector. Australian Import Prices also slipped, posting a decline of 3.0%. This was the sharpest drop since December 2010.

In the US, Advance GDP soared in Q2, posting a gain of 4.0%. This easily beat the estimate of 3.1%. The boost in economic activity was boosted by strong consumer confidence and business activity in Q2. Meanwhile, ADP Nonfarm Payrolls was unable to keep pace. The key employment indicator dropped to 218 thousand, compared to 284 thousand a month earlier. This was well off the estimate of 234 thousand. If the official Nonfarm Payrolls follows suit with a weak reading, the US dollar could give up its recent gains.

If CB Consumer Confidence is any indication, the US consumer is brimming with optimism about the economy. The key indicator jumped to 90.9 points, crushing the estimate of 85.5 points. This was the indicator’s highest level since September 2007. Consumer confidence is closely tracked by analysts since a confident consumer is likely to increase consumption, which is critical for economic growth.

AUD/USD for Thursday, July 31, 2014

AUD/USD July 31 at 13:45 GMT

AUD/USD 0.9300 H: 0.9330 L: 0.9280

AUD/USD Technical

S3

S2

S1

R1

R2

R3

0.9020

0.9119

0.9229

0.9361

0.9446

0.9617

AUD/USD was flat in the Asian session. The pair edged lower in the European session, dropping below the 0.94 line. AUD/USD is steady in the North American session.

0.9229 continues to provide support.

0.9361 is the next resistance line.

Current range: 0.9229 to 0.9361

Further levels in both directions:

Below: 0.9229, 0.9119 and 0.9020

Above: 0.9361, 0.9446, 0.9617 and 0.9757

OANDA’s Open Positions Ratio

AUD/USD ratio is pointing to gains in long positions on Thursday, reversing the direction seen a  day earlier. This is not consistent with the movement of the pair, as the Australian dollar continues to post losses. The ratio has a slight majority of long positions, indicative of trader bias as to the Australian dollar moving higher.

AUD/USD Fundamentals

1:30 Australian Building Approvals. Estimate -1.0%. Actual -5.0%.

1:30 Australian Import Prices. Estimate -1.4%. Actual -3.0%.

1:30 Australian Private Sector Credit. Estimate 0.4%. Actual 0.7%.

11:30 US Challenger Job Cuts. Actual 24.4%.

12:30 US Unemployment Claims. Estimate 303K. Actual 302K.

12:30 US Employment Cost Index. Estimate 0.5%. Actual 0.7%.

13:45 US Chicago PMI. Estimate 63.2 points. Actual 52.6 points.

14:30 US Natural Gas Storage. Estimate 92B.

* Key releases are highlighted in bold

*All release times are GMT

Get OANDA’s exclusive weekly Market Pulse FX

Email Address:

Preferred Format:

HTML Text

This article is for general information purposes only. It is not investment advice or a solution to buy or sell securities. Opinions are the authors; not necessarily that of OANDA Corporation or any of its affiliates, subsidiaries, officers or directors. Leveraged trading is high risk and not suitable for all. You could lose all of your deposited funds.

USD/JPY – Yen Slides on Sharp US GDP

The Japanese yen continues to sag, as USD/JPY is trading in the high-102 range. The yen lost close to a cent on Wednesday, as US GDP jumped 4.0%. Taking a look at Thursday’s events, Japanese data was weak, as Average Cash Earnings and Housing Starts disappointed. In the US, Unemployment Claims is today’s highlight. The markets are braced for rise in the number of claims, with an estimate of 303 thousand.

In the US, GDP soared in the second quarter, expanding at an annual rate of 4.0%. This easily beat the estimate of 3.1%. The boost in economic activity was boosted by strong consumer confidence and business activity in Q2. Meanwhile, ADP Nonfarm Payrolls was unable to keep pace. The key employment indicator dropped to 218 thousand, compared to 284 thousand a month earlier. This was well off the estimate of 234 thousand. If the official Nonfarm Payrolls follows suit with a weak reading on Friday, the US dollar could give up its recent gains.

CB Consumer Confidence was outstanding in June. The key indicator jumped to 90.9 points, crushing the estimate of 85.5 points. This was the indicator’s highest level since September 2007. Consumer confidence is closely tracked by analysts since a confident consumer is likely to increase consumption, which is critical for economic growth. The strong reading has helped the dollar posts gains against the retreating yen.

Japanese data continues to struggle this week. Average Cash Earnings slipped to a four-month low, while Housing Starts posted its fourth straight decline. Earlier this week, Preliminary Industrial Production, an important manufacturing release, posted a sharp drop of 3.3% in June. This is the indicator’s sharpest decline since June 2013. There was no relief from Household Spending and Retail Sales, as both consumer spending indicators posted a third straight decline. These figures point to trouble in the economy, as a decrease in consumer spending will likely translate into weaker economic growth and put more pressure on the struggling Japanese yen.

USD/JPY for Thursday, July 31, 2014

USD/JPY July 31 at 12:00 GMT

USD/JPY 102.88 H: 102.92 L: 102.72

USD/JPY Technical

S3

S2

S1

R1

R2

R3

100.00

101.19

102.53

103.07

104.17

105.70

USD/JPY is showing little activity in the Asian and European sessions.

102.53 has reverted to a support level as the pair trades at higher levels. 101.19 is stronger.

103.07 is an immediate resistance line. 104.17 follows.

Current range: 102.53 to 103.07

Further levels in both directions:

Below: 102.53, 101.19, 100 and 99.57

Above: 103.07, 104.17, 105.70, 106.55

OANDA’s Open Positions Ratio

USD/JPY ratio is pointing to strong gains in short positions in on Thursday. This is consistent with the sharp gains posted by the dollar on Wednesday, which has resulted in the covering of long positions, leading to a higher percentage of open short positions. The ratio continues to have a majority of long positions, indicating strong trader bias towards the dollar continuing to move to higher ground.

USD/JPY Fundamentals

11:30 US Challenger Job Cuts. Actual 24.4%.

12:30 US Unemployment Claims. Estimate 303K.

12:30 US Employment Cost Index. Estimate 0.5%.

13:45 US Chicago PMI. Estimate 63.2 points.

14:30 US Natural Gas Storage. Estimate 92B.

* Key releases are highlighted in bold

*All release times are GMT

Get OANDA’s exclusive weekly Market Pulse FX

Email Address:

Preferred Format:

HTML Text

This article is for general information purposes only. It is not investment advice or a solution to buy or sell securities. Opinions are the authors; not necessarily that of OANDA Corporation or any of its affiliates, subsidiaries, officers or directors. Leveraged trading is high risk and not suitable for all. You could lose all of your deposited funds.

EUR’s fall from grace put on hold until NFP

The forex market has had a little bit of everything thrown at itself over the past 24-hours. It looks like an asset class that wants to make up for lost time in a hurry. Finally, fundamental and technical themes are beginning to join the dots that both ‘volatility and volume,’ in the current low rate environment, had been missing.

It’s simple; all that investors’ want is the opportunity for price movement. From Argentinian sovereign debt defaults (albeit brief), to +4% US GDP growth reports, to Euro unemployment surprises and ongoing deflation concerns, to Fed dissenters, to geopolitical risk, this market has a plethora of reasons to get involved and change their tact for the remainder of this year. Tomorrow is Non-Farm Payrolls (expected +230k, +6.1% unemployment rate) – will the report stick to the consensus headline script or will seasonal factors blow expectations away? If nothing else, this week has already been able to bring enough surprises for investors to consider changing some of their longer-term strategies or get burnt later.

Fed stays the course

Much higher than expected US GDP (+4% vs. +3.1%) and incrementally more ‘hawkish’ statement from the FOMC has managed to push US treasury yields up, leading to a stronger USD, and slightly lower precious metals prices. US 10′s have succeeded in backing up +9bps to +2.54-5% territory, USD/JPY has briefly tested the psychological 103 figure, while December gold futures are down for the fourth consecutive day at $1,295.

To date, the Fed has been very transparent in signposting their intentions. The market expected the ongoing commitment to taper, while continuing to scour for clues on rate hike timing, which obviously depends on the Fed’s interpretation of stronger data, especially in the labor sector. On the whole, no real surprises, but the Fed’s been squeezed by both the market and fundamentals and is required to tread carefully.

Yesterday, Fed’s Plosser was a lone dissenter on the committee, voting in favor of keeping the “considerable time period” clause in the statement, even as the Fed acknowledged further declines in unemployment in spite of continued “underutilization of labor resources” or in other terms spare capacity (a phrase infamously being used by most CBanks). On inflation, the statement noted that it was somewhat closer to the Committee’s longer-run objective, and the likelihood of inflation running persistently below +2% has diminished somewhat (dealers will be looking closely at tomorrows PCE index – the Fed’s preferred inflation gauge). As expected, the Fed tapered QE by another $10B to $25B per month. If they want to finish taper by October they will need to up the ante in taper amount, as there is only two more meetings.

‘Less’ Dovish Favors Dollar

It’s no surprise to see the dollar trade higher across the board (AUD sub $93c, EUR through €1.34, JPY eyeing 103) and gather momentum as US yields back up. With the Fed continuing to shift to a ‘less’ dovish policy is and should provide a more supportive stance for the dollar for the remainder of the year. Nevertheless, the markets will want to take a timeout and catch their breath ahead of tomorrows “granddaddy” of economic releases – non-farm payrolls.

In catching its breath, this morning’s expected lower “low” on Eurozone headline inflation is not having much of a market impact on the single unit (€1.3385), nor are tumbling Euro bourses. The headline +0.4% print was already mostly priced in, and the core inflation rate remaining steady at June’s +0.8% is not an influencer. The Euro’s problem remains with the peripheries; Spain’s -0.3% m/m prints and Italy’s y/y flat rate (vs. +0.2% expectation) would suggest ongoing deflation concerns. Nonetheless, Draghi and company will not be rushed to act, not at least until they can gauge the impact of the TLTRO program (targeted longer term refinance operations). Record low Euro yields and the German Bund “bull flattener” combined with the EUR’s ongoing weakness would suggest that the market is already happy to do the job of loosening policy for the ECB.

Argentina is in a technical sovereign default after not paying its debt holders by yesterday’s deadline. Currently, there is no EM fallout from non-payment for a number of reasons – the risk was long expected and more importantly, Argentina has long been isolated from Capital Markets after the 2001/2 defaults. Obviously their situation will only make the country’s severe economic problems even more difficult. By day’s end, Emerging Markets are more sensitive to a rise in US treasury yields on solid economic data. Will tomorrow’s US jobs report put the squeeze on yields again?

Forex heatmap

Gold Flat Ahead of Unemployment Claims

Gold prices are steady on Thursday, as the metal continues to trade close to the $1300 level. In the European session, the spot price stands at $1295.01 per ounce. In the US, today’s highlight is Unemployment Claims. The markets are braced for a rise in claims, which would likely have a negative impact on the dollar.

In the US, GDP soared in the second quarter, expanding at an annual rate of 4.0%. This easily beat the estimate of 3.1%. The boost in economic activity was boosted by strong consumer confidence and business activity in Q2. Meanwhile, ADP Nonfarm Payrolls was unable to keep pace. The key employment indicator dropped to 218 thousand, compared to 284 thousand a month earlier. This was well off the estimate of 234 thousand. If the official Nonfarm Payrolls follows suit with a weak reading on Friday, the US dollar could give up its recent gains.

The Federal Reserve released a policy statement on Wednesday, with the Fed sounding somewhat dovish in tone. Policymakers acknowledged lower unemployment levels, but noted that “there remains significant underutilization of labor resources” in the economy. The Fed statement reinforces the view that the US central bank is in no rush to raise interest rates after the termination of QE, which is expected in October. As well, the Fed said that inflation levels have moved somewhat closer to the Fed’s target of 2.0%.

CB Consumer Confidence was outstanding on Tuesday, pointing to a sharp increase in June. The key indicator jumped to 90.9 points, crushing the estimate of 85.5 points. This was the indicator’s highest level since September 2007. Consumer confidence is closely tracked by analysts since a confident consumer is likely to increase consumption, which is critical for economic growth.

XAU/USD for Thursday, July 31, 2014

XAU/USD July 31 at 10:05 GMT

XAU/USD 1295.02 H: 1297.35 L: 1294.22

XAU/USD Technical

S3

S2

S1

R1

R2

R3

1240

1252

1275

1300

1315

1331

XAU/USD has shown little movement in the Asian and European sessions. The pair touched a low of 1291 late in the Asian session.

On the upside, 1300 remains under pressure. 1315 is the next line of resistance.

1275 continues to provide support. 1252 follows.

Current range: 1275 to 1300.

Further levels in both directions:

Below: 1275, 1252, 1240 and 1208

Above: 1300, 1315, 1331 and 1345

OANDA’s Open Positions Ratio

XAU/USD ratio is pointing to gains in long positions on Thursday. This is not consistent with the lack of movement we are seeing from the pair. The ratio has a majority of long positions, indicative of trader bias towards gold prices breaking out of range and moving upwards.

XAU/USD Fundamentals

11:30 US Challenger Job Cuts.

12:30 US Unemployment Claims. Estimate 303K.

12:30 US Employment Cost Index. Estimate 0.5%.

13:45 US Chicago PMI. Estimate 63.2 points.

14:30 US Natural Gas Storage. Estimate 92B.

*Key releases are highlighted in bold

*All release times are GMT

This article is for general information purposes only. It is not investment advice or a solution to buy or sell securities. Opinions are the authors; not necessarily that of OANDA Corporation or any of its affiliates, subsidiaries, officers or directors. Leveraged trading is high risk and not suitable for all. You could lose all of your deposited funds.

Get OANDA’s exclusive weekly Market Pulse FX

Email Address:

Preferred Format:

HTML Text

EUR/USD – Flat on Mixed Eurozone Data

The euro is unchanged on Thursday, as EUR/USD continues to trade just shy of the 1.34 level in the European session. It’s been a July to forget for the struggling euro, which has coughed up about 300 points to the surging US dollar. On the release front, Eurozone indicators were mixed. German Retail Sales and Unemployment Change beat their estimates, and French Consumer Spending posted another strong gain. Eurozone CPI and Unemployment Rate met expectations. In the US, today’s highlight is Unemployment Claims. The markets are braced for a rise in claims, which would likely have a negative impact on the dollar.

Eurozone CPI, one of most important indicators, edged lower to 0.4%. Although this was close to the estimate of 0.5%, this figure was the lowest in almost five years, and raises concerns of deflation. There was better news from the Eurozone Unemployment Rate, which dipped to 11.4%, its lowest level since September 2012. German data was positive, led by Retail Sales which jumped 1.3%, beating the estimate of 1.1%. German Unemployment Change posted a decline of 12,000, easily surpassing the estimate of a drop of 5,000.

In the US, GDP soared in the second quarter, expanding at an annual rate of 4.0%. This easily beat the estimate of 3.1%. The boost in economic activity was boosted by strong consumer confidence and business activity in Q2. Meanwhile, ADP Nonfarm Payrolls was unable to keep pace. The key employment indicator dropped to 218 thousand, compared to 284 thousand a month earlier. This was well off the estimate of 234 thousand. If the official Nonfarm Payrolls follows suit with a weak reading on Friday, the US dollar could give up its recent gains.

CB Consumer Confidence was outstanding on Tuesday, pointing to a sharp increase in June. The key indicator jumped to 90.9 points, crushing the estimate of 85.5 points. This was the indicator’s highest level since September 2007. Consumer confidence is closely tracked by analysts since a confident consumer is likely to increase consumption, which is critical for economic growth.

EUR/USD for Thursday, July 31, 2014

EUR/USD July 31 at 8:50 GMT

EUR/USD 1.3398 H: 1.3400 L: 1.3385

EUR/USD Technical

S3

S2

S1

R1

R2

R3

1.3175

1.3295

1.3346

1.3487

1.3585

1.3651

EUR/USD is almost unchanged, with little activity in the Asian and European sessions.

1.3346 continues to provide support. 1.3295 is stronger.

On the upside, 1.3487 has some breathing room as the pair trades at the 1.34 line.

Current range: 1.3346 to 1.3487

Further levels in both directions:

Below: 1.3346, 1.3295, 1.3175 and 1.3104

Above: 1.3487, 1.3585, 1.3651 and 1.3786

OANDA’s Open Positions Ratio

EUR/USD ratio is almost unchanged in Thursday trade. This is consistent with the lack of movement displayed by the pair. The ratio has a majority of long positions, indicative of trader bias towards the euro reversing breaking out and moving higher.

EUR/USD Fundamentals

6:00 German Retail Sales. Estimate 1.1%. Actual 1.3%.

6:45 French Consumer Spending. Estimate 0.3%. Actual 0.9%.

7:55 German Unemployment Change. Estimate -5K. Actual -12K.

8:00 Italian Monthly Unemployment Rate. Estimate 12.6%. Actual 12.3%.

9:00 Eurozone CPI Flash Estimate. Estimate 0.5%. Actual 0.4%.

9:00 Eurozone Core CPI Flash Estimate. Estimate 0.8%. Actual 0.8%

9:00 Eurozone Unemployment Rate. Estimate 11.6%. Actual 11.5%.

9:00 Italian Preliminary CPI. Estimate +0.1%. Actual -0.1%.

11:30 US Challenger Job Cuts.

12:30 US Unemployment Claims. Estimate 303K.

12:30 US Employment Cost Index. Estimate 0.5%.

13:45 US Chicago PMI. Estimate 63.2 points.

14:30 US Natural Gas Storage. Estimate 92B.

*Key releases are highlighted in bold

*All release times are GMT

Get OANDA’s exclusive weekly Market Pulse FX

Email Address:

Preferred Format:

HTML Text

This article is for general information purposes only. It is not investment advice or a solution to buy or sell securities. Opinions are the authors; not necessarily that of OANDA Corporation or any of its affiliates, subsidiaries, officers or directors. Leveraged trading is high risk and not suitable for all. You could lose all of your deposited funds.
Asian Equities Lower

Asian stocks outside Japan fell, with Hong Kong’s Hang Seng Index retreating from a more-than three-year high, as Samsung Electronics Co. led information technology shares lower.

Samsung sank 3.9 percent in Seoul as the world’s biggest maker of smartphones posted net income that fell short of expectations amid increased competition from Apple Inc. and Chinese producers. Singapore Airlines Ltd. slipped 2.4 percent after Asia’s second-largest carrier by market value reported weaker earnings. Mitsubishi Motors Corp. gained 2.3 percent in Tokyo after the carmaker’s profit beat analysts’ estimates.

The MSCI Asia Pacific excluding Japan Index dropped 0.4 percent to 510.32 as of 11:53 a.m. in Hong Kong, paring its monthly advance to 3.3 percent. The MSCI Asia Pacific Index, which included Japan, slipped 0.1 percent to 149.33 after climbing 2.6 percent this month through yesterday, when it closed near the highest level since June 2008. It is poised for a third month of gains.

Bloomberg

West TX Oil at $99.95 as U.S. Fuel Supplies Rise

West Texas Intermediate dropped for a fourth day and slipped below $100 as gasoline stockpiles rose and demand declined in the U.S., the world’s biggest oil user. Brent decreased in London.

Futures fell as much as 1.1 percent in New York. Gasoline supplies expanded by 365,000 barrels last week to 218.2 million, the highest level in four months, the Energy Information Administration said yesterday. Average consumption shrank 0.5 percent over the past four weeks to the lowest since May, even as the country’s peak driving season started with the Memorial Day holiday on May 26.

“This should be a period of peak demand,” said Jonathan Barratt, the chief investment officer at Ayers Alliance Securities in Sydney. “The price action is telling us the world does not have an issue with the supply of crude. Oil at $100 is a big level, and I don’t think it will give it up so quickly.”

Bloomberg

U.S. Q2 GDP Rises an Unexpected 4%

The economic expansion in the second quarter picked up where it left off late last year, led by gains in consumer spending and business investment that indicate the U.S. slump at the start of 2014 was an anomaly.

Gross domestic product rose at a 4 percent annualized rate from April through June, exceeding the median forecast of economists surveyed by Bloomberg, after shrinking 2.1 percent in the first quarter, Commerce Department figures showed today in Washington. The increase matched the average growth rate from July through December of 2013 that marked the strongest six months in a decade.

“The economy is looking pretty darned good,” said Stuart Hoffman, chief economist at PNC Financial Services Group Inc. in Pittsburgh, the only economist in the Bloomberg survey to accurately forecast the gain in GDP. “The momentum for the second half is solid. The labor market is driving this growth, which means companies are looking for workers. The big picture looks a lot brighter and is probably more accurate” than the first-quarter reading suggested.

Bloomberg

Wednesday, July 30, 2014

IMF: China Should Set Lower GDP Target of 6.5 – 7%

China should set an economic growth target of 6.5-7 percent for 2015, below its goal for 2014, and refrain from stimulus measures unless the economy threatens to slow sharply from that level, the International Monetary Fund said on Thursday.

Most of its directors hold that view, though some feel that an even-lower growth target is appropriate, the IMF said.

In the conclusion of its annual Article IV economic consultation with China, the IMF repeated its projection that the economic growth would dip to 7.4 percent this year, and decelerate further to 7.1 percent next year.

CNBC

U.S. Dollar Stays Strong after Solid Data

The U.S. dollar stayed strong and U.S. bond yields held firm on Thursday after data showed solid U.S. economic growth, even as the Federal Reserve repeated its message that it is in no hurry to raise interest rates.

While the prospect of a solid U.S. recovery underpinned equities, many Asian shares slipped on profit-taking after making hefty gains since the middle of this month.

MSCI’s broadest index of Asia-Pacific shares outside Japan dipped 0.3 percent but held still not far from 6 1/2-year high hit on Wednesday. The Nikkei average rose 0.3 percent while Australian shares inched up to hit six-year highs.  European shares are expected to open slightly firmer, with France’s CAC40 seen rising up to 0.3 percent and Britain’s FTSE 0.1 percent.

Reuters

IMF: China Faces a “Hard Landing”

China faces a “hard landing” before the end of the decade unless policymakers implement the vital structural reforms that will make growth sustainable over the long term, the International Monetary Fund has warned.

In its annual healthcheck of the Chinese economy, the IMF recommended that China target growth of less than 7pc next year in order to reach its goal of “transitioning to a safer and more sustainable growth path”.

The IMF urged policymakers to step up efforts to move the economy away from its over-reliance on investment and exports to drive growth and shift the balance towards consumption. It also repeated its call for China to open up its economy, allow the renminbi to move with market forces and take further steps to rein in the country’s credit boom.

Telegraph

U.S. Dollar Remains Bullish

The dollar held below a 10-month peak against a basket of major currencies on Thursday after soaring on upbeat U.S. growth data, with mixed views from the Federal Reserve tempering the rally.  However, the dollar looked poised to resume rising should U.S. indicators due by Friday continue to paint a brighter economic picture.

The dollar index last traded at 81.386 after rising as far as 81.545 – a high last seen in mid-September. Still, the index is up more than 2 percent so far this month, on track for its biggest monthly gain in over a year.

Dollar bulls took heart after the U.S. economy rebounded sharply in the second quarter, with gross domestic product (GDP) motoring at a 4.0 percent annualized pace.

CNBC

Gold Below $1294 as U.S. Economy Improves

Gold retreated for a fourth day to head for a monthly decline as further signs that the U.S. recovery is gaining momentum strengthened the case for higher borrowing costs in the world’s largest economy.

Gold for immediate delivery fell as much as 0.2 percent to $1,294.24 an ounce, and was at $1,294.97 at 11:28 a.m. in Singapore, according to Bloomberg generic pricing. A fourth day of losses would be the longest streak since June. Bullion dropped 2.4 percent in July, while the Bloomberg Dollar Spot Index headed for the biggest monthly rise since May 2013, as data including gross domestic product beat estimates.

Gold sank 28 percent last year on expectations that the Federal Reserve would trim monthly bond buying, which it did for a sixth time yesterday. Policy makers also said in their July 30 statement that slack in the labor market persisted even as the economy was picking up, repeating that they will keep interest rates low for a considerable time after ending asset purchases. Data tomorrow may show U.S. employers added more than 200,000 jobs for a sixth month.

Bloomberg

Fed Still Focused on Labor Weakness

The Federal Reserve on Wednesday upgraded its assessment of the U.S. economy, taking note of a decline in the jobless rate and signaling more comfort that inflation was moving up toward its target.

Still, after a two-day meeting, Fed policymakers reiterated concerns about slack in the labor market and reaffirmed that it is in no rush to raise interested rates.  As widely expected, the central bank cut its monthly asset purchases to $25 billion from $35 billion, leaving it on course to shutter the program this fall.

“Labor market conditions improved, with the unemployment rate declining further,” the Fed said in a statement. “However, a range of labor market indicators suggests that there remains significant underutilization of labor resources.”

Reuters

Australian Numbers Don’t Paint a Rosy Picture

Slow credit growth, falling export prices and a drop in home-building approvals – it was hardly an encouraging set of economic data on Thursday.  But it was a pretty good illustration of the problems facing the economy.

A 7.9 per cent fall in the export price index in the June quarter, reported by the Australian Bureau of Statistics on Thursday, was dominated by weaker minerals markets.  It extended the fall to since the peak in 2011 to 15 per cent.  The fall has been partially cushioned by a lower exchange rate.  In foreign currency terms, export commodity prices have dropped over 30 per cent in just three years, according to the commodity price index compiled by the RBA.

But the hit to export revenue will still drag on the economy, accentuating the impact of the slowdown in resource sector investment.  The building industry is one of the great hopes for the economy’s transition away from mining, the so-called rebalancing.

The Australian

British Consumer Confidence Falls for First Time in Six Months

British consumer confidence fell for the first time in six months in July, a survey from researchers GfK NOP showed on Thursday, the latest sign that Britons are feeling less upbeat about the economic recovery.

GfK NOP’s headline consumer confidence index fell to -2 in July from 1 in June, which had been the first positive reading in the survey in nearly 10 years.

The fall contrasted with the average forecast in a Reuters poll for a rise to 2 in the main index, which had been steadily improving from readings well below zero.  “The almost relentless rise of the last six months couldn’t continue indefinitely, and the government will be hoping this is just a temporary setback rather than the forerunner of a wider decline in confidence,” said Nick Moon, managing director of GfK NOP Social Research, in a statement.

Reuters

IMF Sees Numerous Risks in China

Weakness in China’s real estate sector poses near-term risks for the world’s second-largest economy, a senior International Monetary Fund (IMF) official said on Thursday.

Near-term risks in China’s economy remained manageable due to the government’s policy buffers, Markus Rodlauer, deputy director of the IMF’s Asia Pacific Department and the fund’s mission chief for China, told reporters.

However, he said it was increasingly urgent for the government to push economic reforms because the current path of growth was unsustainable.

Reuters

USD/JPY Moves Through 103 after U.S. GDP

The dollar headed for its biggest monthly gain versus the euro since February last year as signs the U.S. economy is strengthening spur traders to boost predictions for higher interest rates.

The U.S. currency has risen versus all except one of its 16 major counterparts in July as reports have shown gross domestic product rebounded, consumer confidence improved and durable goods orders increased. Treasury 10-year yields climbed to a two-week high yesterday, while economists predict data tomorrow will show U.S. employers added more than 200,000 jobs for a sixth month. Australia’s dollar approached an eight-week low after building approvals unexpectedly declined.

“The tide has turned in the markets after the GDP data, with long-term U.S. yields finally rising again and increasing the momentum for dollar buying,” said Naohiro Nomoto, an associate for foreign-exchange trading at Bank of Tokyo-Mitsubishi UFJ Ltd. in New York. “Investors have priced in a strong payrolls report.”

Bloomberg

West TX Oil Continues Decline to Below $100

U.S. crude oil futures fell under $100 in early Thursday trade, putting the contract on course for its steepest monthly slide in nine months, as concerns over weak demand rose while fears over supply shortages in the Middle East and North Africa waned.

U.S. crude futures for September delivery fell 80 cents to $99.47 a barrel by 0007 GMT, putting the contract on course for a 5.6 percent fall for the month – its deepest since October.

The contract finished 70 cents lower on Wednesday.  U.S. crude stockpiles fell more than forecast last week, while gasoline and distillate inventories rose less than expected, the Energy Information Administration reported on Wednesday.

CNBC

Fed Takes Steam Out of U.S. Dollar Rally

The U.S. dollar held below a 10-month peak against a basket of major currencies early on Thursday, having soared at first on upbeat growth data only to have a dovish Federal Reserve take some steam out of the rally.

The dollar index last traded at 81.422 after rising as far as 81.545 – a high last seen in mid-September. Still, the index is up more than 2 percent so far this month, on track for its biggest monthly gain in over a year.

Dollar bulls took heart after the U.S. economy rebounded sharply in the second quarter, with gross domestic product (GDP) motoring at a 4.0 percent annualized pace.  That outcome was well above the 3.0 percent consensus and a smart turnaround from a 2.1 percent contraction in the first quarter.

CNBC

Economist: Fed’s Easing Will Likely Lead to Inflation

It’s unlikely the Federal Reserve will be able to pull off a graceful ending to quantitative easing, economist Bob Brusca told CNBC. Instead, he thinks the central bank will probably allow inflation to creep up—not believing it is real—until it is too late.

“They think there’s a lot of slack, and therefore when bad things happen they don’t believe it. And that’s the problem: When bad things happen you have to believe it,” said Brusca, chief economist at Fact and Opinion Economics.  The central bank is grappling with several issues, he added.

“The Fed’s balance sheet is huge. I think they kept interest rates very low for a very long period of time,” Brusca said in an interview with “Power Lunch.” The central bank is also juggling “too many things” and is dealing with a division among its members.  “A division is also going to make it harder to do the right thing in a timely fashion.”

CNBC

Rates Talk Begins after Strong U.S. Growth

A stunning acceleration in second quarter growth and a jump in inflation triggered a new round of speculation that the Fed will have to speed up plans to hike rates.

The faster pace of growth makes it more likely the economy will grow at a better clip in the second half, but strategists do not expect the Fed to change its timeline unless there is a consistent jump in activity. The number is not expected to have any impact on the Fed statement scheduled for 2 p.m. EDT Wednesday.

Second quarter GDP grew at 4 percent, well above the expected 3 percent. Traders focused on the faster pace of inflation at 2.3 percent annual rate, compared with 1.4 percent in the first quarter, as measured by the personal consumption expenditures index. That is above the Fed’s 2 percent target rate.

CNBC

Gold – Threatening to Stay Below $1300

Gold for Thursday, July 31, 2014

In the last few days gold has been easing lower and placing pressure on the support level at $1300 which maybe about to give way.  Over the last few weeks the $1290 level has shown some signs of support and held gold up.  Gold did well at the end of last week to surge higher through the $1300 level back up towards $1310 before easing slightly to start this new week. The $1300 level has been reinforced as a level of significance in the last couple of weeks with gold falling sharply from its highs above $1345 back down to this level where it has been met with overwhelming demand, although this support seems to be wavering.  During the second half of June, gold steadily moved higher but showed numerous incidents of indecision with its multiple doji candlestick patterns on the daily chart. This happened around $1320 and $1330. Several weeks ago now gold enjoyed a stunning surge higher to break through some key levels along its way to reaching a then two month high just above $1320 and immediately after it eased away ever so slightly and consolidated with its flow of doji patterns. It was then able to slowly move higher to a four month high above $1345. It was also able to break through the $1300 level which has recently played a role again. If sellers do take advantage of these relatively higher prices which will most likely bring the $1300 level back into play. The OANDA long position ratio has surged back up towards 70% showing a change in sentiment to more bullish.

At the beginning of June, gold did very well to repair some damage and return to the key $1275 level, then it has continued the momentum pushing a higher to its recent four month high. After moving so little for an extended period, gold dropped sharply several weeks ago from above the well established support level at $1275 as it completely shattered this level falling to a four month low around $1240. It remained around support at $1240 for several days before its recent rally higher. Prior to the strong fall a few weeks ago gold had remain fixated on the $1293 level and had done very little as volatility has dried up completely resulting in gold moving very little. It pushed down towards $1280 before sling shotting back and also had an excursion above $1300 for a short period before moving quickly back to the $1293 area again. Over the last few weeks gold has eased back from around $1315 to establish its recent narrow trading range below $1295 before its recent slump.

Over the last few months the $1275 level has established itself as a level of support and on several occasions has propped up the price of gold after reasonable falls. Throughout the second half of March gold fell heavily from resistance around $1400 back down to a several week low near support at $1275. Both these levels remain relevant as $1275 continues to offer support and the $1400 level is likely to play a role again should gold move up higher. Through the first couple of months of this year, gold moved very well from a longer term support level around $1200 up towards a six month higher near $1400 before returning to its present trading levels closer to $1300.

Gold held overnight losses to trade below $1,300 an ounce on Thursday and looked likely to extend declines to a fourth day as optimism over U.S. economic growth curbed safe-haven appetite for the metal.  Spot gold was flat at $1,295.20 an ounce by 0021 GMT, after dropping 0.3 percent in the previous session.  The Federal Reserve on Wednesday reaffirmed it was in no rush to raise interest rates, even as it upgraded its assessment of the U.S. economy and expressed some comfort that inflation was moving up toward its target.  After a two-day meeting, Fed policymakers took note of both faster economic growth and a decline in the unemployment rate, but expressed concern about remaining slack in the labor market.  Data on Wednesday also showed that the U.S. economy rebounded sharply in the second quarter as consumers stepped up spending and businesses restocked. Gross domestic product expanded at a 4 percent annual rate after shrinking at a revised 2.1 percent pace in the first quarter.

(Daily chart / 4 hourly chart below)

g_20140731 g_20140731_4hour

Gold July 31 at 03:40 GMT   1294.4   H: 1297.3   L: 1294.1

Gold Technical

S3

S2

S1

R1

R2

R3

1290

1275

1240

1330

During the early hours of the Asian trading session on Thursday, Gold is trading in a very small range between $1294 and $1297 after dropping a little in the last 12 hours or so.   Current range: trading right below $1300 around $1295.

Further levels in both directions:

• Below: 1290, 1275 and 1240.

• Above: 1330.

OANDA’s Open Position Ratios

g_20140731_ratio

(Shows the ratio of long vs. short positions held for Gold among all OANDA clients. The left percentage (blue) shows long positions; the right percentage (orange) shows short positions.)

The long position ratio for Gold has held well above 60% as gold has eased back under $1300 again.  The trader sentiment is strongly in favour of long positions.

Economic Releases

01:30 AU Building approvals (Jun)

01:30 AU Export & Import price index (Q2)

05:00 JP Housing starts (Jun)

06:00 JP Construction orders (Jun)

09:00 EU Flash HICP (Jul)

09:00 EU Unemployment (Jun)

12:30 CA GDP (May)

12:30 US Employment cost index (Q2)

12:30 US Initial Claims (26/07/2014)

13:45 US Chicago PMI (Jul)

*All release times are GMT

This article is for general information purposes only. It is not investment advice or a solution to buy or sell securities. Opinions are the authors; not necessarily that of OANDA Corporation or any of its affiliates, subsidiaries, officers or directors. Leveraged trading is high risk and not suitable for all. You could lose all of your deposited funds.

Australia 200 – Surges Through 5600 to New High

Australia 200 for Thursday, July 31, 2014

The Australia 200 Index is presently on quite a roll as it has enjoyed a solid three week period which has seen it move strongly up through both the 5500 and 5550 levels to reach a new six year high around 5620 in the last day or so.  In recent weeks it has discovered a new key level to deal with after running into a short term resistance level at 5550, which in the last few days has provided some solid support.  It reversed strongly a few weeks ago bringing it back down to almost touch the 5400 level before rallying back higher again. At the beginning of June the Australian 200 Index fell and broke back down through the key 5500 level towards a four week low around 5400 before consolidating and resting on support there for an extended period. These two levels have firmly established themselves as significant and any substantial break to either side will most likely be a significant move and be closely monitored. It is quite likely many are sitting on the sidelines waiting for the break before committing as they continue to watch the index move between these two levels.

Back at the end of May, it moved back and forth between the two key levels of 5500 and 5550 before the recent fall. Over the last couple of months the Australia 200 Index has formed an amazing attraction to the key 5500 level as it spent a considerable amount of time trading around it. A couple of weeks ago, the index fell away heavily back down to support around 5400 before returning to the key 5500 level just as quickly, as if gravity had pulled it back. Throughout the last couple of months it has been placing ongoing pressure on the resistance level at 5500 and a few weeks ago it was finally able to move through to a three week high before easing back again to this key level. Several weeks ago it slowly but surely eased away from its multi-year high achieved near 5560 however the following week it fell reasonably sharply and started looking towards the 5400 level which is near where it currently sits. In doing so it returned to back under the key 5500 level which has provided some reasonable resistance over the last few months.

For the bulk of the last few months, the Australia 200 Index has traded roughly between 5300 and 5500 therefore its return to back under 5500 was not surprising. The index has done well over the last couple of months to move steadily higher from support around 5300 up to beyond 5500, forming higher peaks and higher troughs along the way. The support level at 5300 may also be called upon should the index fall lower and will also likely play a role in providing some buffer from any decline. Since February, most of the trading activity has occurred between 5400 and 5500 therefore the former level may also be called upon to prop up prices. The index has done very well over the last couple of years moving from below 4000 to its present trading levels around 5500.

Prices in the one of the world’s most expensive housing markets are set to pick up pace this year, triggering renewed warnings of a potential bubble brewing.  According to a note from HSBC this week, while growth in real estate prices showed some signs of cooling in May, a strong bounce back in house price data and auction clearance rates in June and July could mean prices will end the year 10 percent higher.  “While we remain of the view that Australia does not currently have a housing bubble, it seems likely that if the current housing market trends were to persist for too long, there would be a risk of inflating one… the longer mortgage rates remain at low levels, the more this risk grows,” said Paul Bloxham, chief economist for Australia and New Zealand at HSBC.  Prices in Australia have more than tripled since 1997, on the back of low interest rates, high incomes and growing demand from Asia.  HSBC says signs of exuberance are most acute in Sydney, which was branded the second-most unaffordable city to buy a house in the English-speaking world by the Demographia International Housing Affordability Survey published earlier this year.  Prices in the city have risen 15 percent in the past 12 months to the end of June, compared to only 7 percent weighted average of other capital cities, HSBC noted. Meanwhile, the investor share of Sydney property has reached record highs.

(Daily chart below)

asx_20140731

Australia 200 July 31 at 03:05 GMT   5609   H: 5624   L: 5596

Australia 200 Technical

S3

S2

S1

R1

R2

R3

5400

5300

5000

During the hours of the Asian trading session on Thursday, the Australia 200 Index is just easing back slightly from its new highs around 5620after moving strongly for the last few weeks.  It is presently trading above the key levels of 5500 and 5550 and will be looking to see if it can maintain the break and stay above. For most of this year the Australia 200 Index has moved well from the lower support level at 5000 up to the multi-year highs above 5500 in the last month or so.

Further levels in both directions:

• Below: 5400, 5300 and 5000.

• Above: —

Economic Releases

01:30 AU Building approvals (Jun)

01:30 AU Export & Import price index (Q2)

05:00 JP Housing starts (Jun)

06:00 JP Construction orders (Jun)

09:00 EU Flash HICP (Jul)

09:00 EU Unemployment (Jun)

12:30 CA GDP (May)

12:30 US Employment cost index (Q2)

12:30 US Initial Claims (26/07/2014)

13:45 US Chicago PMI (Jul)

*All release times are GMT

This article is for general information purposes only. It is not investment advice or a solution to buy or sell securities. Opinions are the authors; not necessarily that of OANDA Corporation or any of its affiliates, subsidiaries, officers or directors. Leveraged trading is high risk and not suitable for all. You could lose all of your deposited funds.
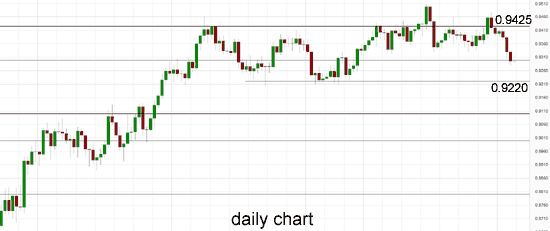
AUD/USD – Drops to Seven Week Low Near 0.9300

AUD/USD for Thursday, July 31, 2014

The Australian dollar is presently trying to rally and stay above the support level at 0.9300 after its sharp fall in recent hours which saw it move from near 0.9400 down to a seven week low just above 0.9300.   It has spent the last few days easing back below both the 0.9425 and 0.9400 levels with the former providing some resistance.  The Australian dollar reached a three week high just shy of 0.9480 towards the end of last week after it enjoyed a solid period which saw it surge higher through the resistance level at 0.9425 to the three week around 0.9480, before easing back towards that level. It started last week by slowly easing away from the resistance level around 0.9425 which continues to stand tall and play havoc with buyers. The Australian dollar enjoyed a solid surge higher reaching a new eight month high above 0.95 a few weeks ago, only to return most of its gains in very quick time to finish out that week. Since the middle of June the Australian dollar has made repeated attempts to break through the resistance level around 0.9425, however despite its best efforts it was rejected every time as the key level continued to stand tall, even though it has allowed the small excursion to above 0.95.

After the Australian dollar had enjoyed a solid surge in the first couple of weeks of June which returned it to the resistance level around 0.9425, it then fell sharply away from this level back to a one week low around 0.9330 before rallying higher yet again. Its recent surge higher to the resistance level around 0.9425 was after spending a couple of weeks at the end of May trading near and finding support at 0.9220. The 0.9220 level has repeatedly reinforced its significance as it is again likely to support price should the Australia dollar retreat further. Throughout April and into May the Australian dollar drifted lower from resistance just below 0.95 after reaching a six month high in that area and down to the recent key level at 0.93 before falling lower. During this similar period the 0.93 level has become very significant as it has provided stiff resistance for some time.

The Australian dollar appeared to be well settled around 0.93 which has illustrated the strong resurgence it has experienced throughout this year. For the best part of February and March the Australian dollar did very little other than continue to trade around the 0.90 level, although at the beginning of March it crept a little lower down to a three week low below 0.89. Towards the end of March however, the Australian dollar surged higher strongly moving to the resistance level at 0.93 before consolidating for a week or so.

Prices in the one of the world’s most expensive housing markets are set to pick up pace this year, triggering renewed warnings of a potential bubble brewing.  According to a note from HSBC this week, while growth in real estate prices showed some signs of cooling in May, a strong bounce back in house price data and auction clearance rates in June and July could mean prices will end the year 10 percent higher.  “While we remain of the view that Australia does not currently have a housing bubble, it seems likely that if the current housing market trends were to persist for too long, there would be a risk of inflating one… the longer mortgage rates remain at low levels, the more this risk grows,” said Paul Bloxham, chief economist for Australia and New Zealand at HSBC.  Prices in Australia have more than tripled since 1997, on the back of low interest rates, high incomes and growing demand from Asia.  HSBC says signs of exuberance are most acute in Sydney, which was branded the second-most unaffordable city to buy a house in the English-speaking world by the Demographia International Housing Affordability Survey published earlier this year.  Prices in the city have risen 15 percent in the past 12 months to the end of June, compared to only 7 percent weighted average of other capital cities, HSBC noted. Meanwhile, the investor share of Sydney property has reached record highs.

(Daily chart / 4 hourly chart below)

a_20140731 a_20140731_4hour

AUD/USD July 31 at 02:50 GMT   0.9319   H: 0.9332   L: 0.9307

AUD/USD Technical

S3

S2

S1

R1

R2

R3

0.9300

0.9220

0.9100

0.9425

0.9500

During the early hours of the Asian trading session on Thursday, the AUD/USD is trying to rally and stay above the support level at 0.9300 after its sharp fall in recent hours which saw it move from near 0.9400 down to a seven week low.  The Australian dollar was in a free-fall for a lot of last year falling close to 20 cents and it has done very well to recover slightly to well above 0.95 again. Current range: trading above 0.9300 around 0.9320.

Further levels in both directions:

• Below: 0.9300, 0.9220 and 0.9100.

• Above: 0.9425 and 0.9500.

OANDA’s Open Position Ratios

a_20140731_ratio

(Shows the ratio of long vs. short positions held for the AUD/USD among all OANDA clients. The left percentage (blue) shows long positions; the right percentage (orange) shows short positions.)

The long position ratio for the AUD/USD has moved back up strongly from its lowest level in over one year as the Australian dollar has eased right back towards 0.93. The trader sentiment has changed to being in favour of long positions.

Economic Releases

01:30 AU Building approvals (Jun)

01:30 AU Export & Import price index (Q2)

05:00 JP Housing starts (Jun)

06:00 JP Construction orders (Jun)

09:00 EU Flash HICP (Jul)

09:00 EU Unemployment (Jun)

12:30 CA GDP (May)

12:30 US Employment cost index (Q2)

12:30 US Initial Claims (26/07/2014)

13:45 US Chicago PMI (Jul)

*All release times are GMT

This article is for general information purposes only. It is not investment advice or a solution to buy or sell securities. Opinions are the authors; not necessarily that of OANDA Corporation or any of its affiliates, subsidiaries, officers or directors. Leveraged trading is high risk and not suitable for all. You could lose all of your deposited funds.