Cable in on the rise again today following a strong retail sales figure from the UK and some less than encouraging data from the US.
While the data has helped the move gather some momentum, there were already warning signals there that we were going to see another assault on last week’s highs following the failed break of the 233-day SMA.
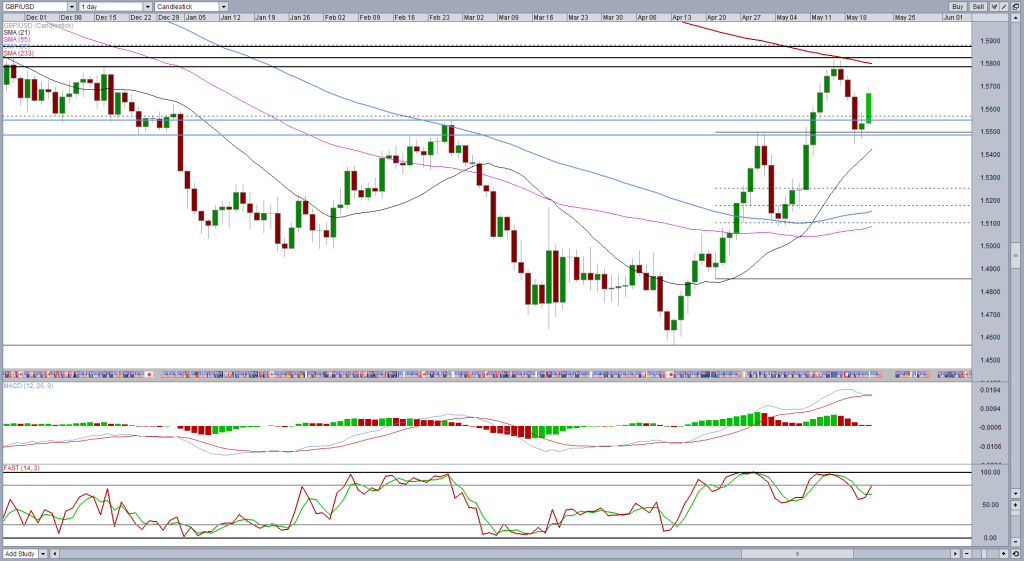
Tuesday’s sell-off was quite aggressive but ran into support around 1.5450 – 1.55. This was always looking like a key test of bearish momentum. The stabilisation that followed yesterday and included a failure to make new lows was a warning that there could be more upside to come.
Now it would appear we’re going to see another attempt to break above a key resistance area, around 1.5780 – 1.5880, with it having offered support and resistance so many times before. The 233-DMA will once again make this task all the more difficult, but at the same time provide a very strong bullish signal if broken.
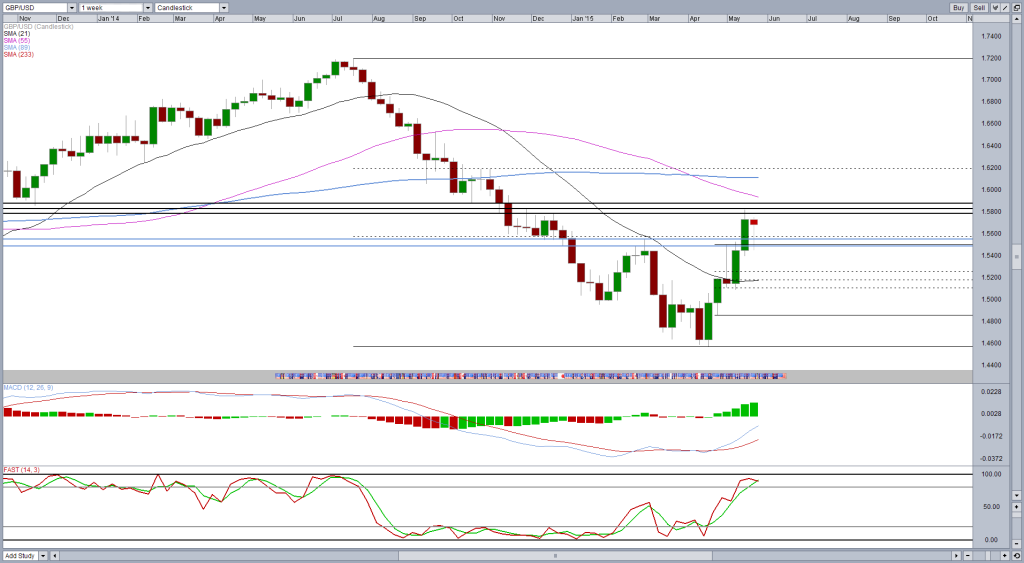
I’m not convinced at this stage that this will be broken as I believe these moves reflect a dollar correction more so than genuine dollar weakness. A break of these levels and the 50 fib level around 1.5880 – 15 July highs to 13 April lows – would suggest otherwise.
A failure to break above last week’s high on the other hand may present an interesting double top formation with the neckline around 1.5450, although we’re some way from that yet. A break of this would surely signal the continuation of the bull run in the dollar.
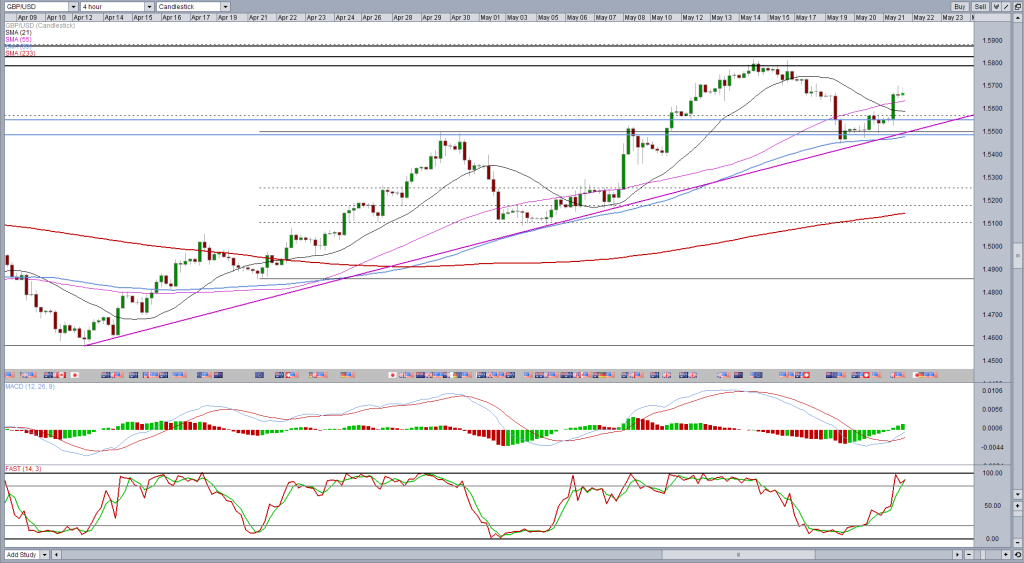
An early signal of this could come from the break of the 89-SMA on the 4-hour chart and the ascending trend line – 13 April lows, which have offered reliable support during the most recent climb.
0 коментарі:
Post a Comment